Two-Way ANOVA is a simple extension (Part I)
Two-Way ANOVA Introduction

Instructions:
Read through this exercise and be sure to commit and push every time I ask you to. You should read the text and copy the text that I write in this post into your R markdown file (do your best to use your own words), making sure you understand what I am doing. This is critical in terms of understanding the analysis. When using your data, consider my suggestion or use the variables that make sense to you.
Also answer questions along the way in your R markdown file. The questions will be in red.
‘When you see purple text commit and state what you just did for your commit.’
1. The purpose of Two-Way ANOVA
The primary purpose of two-way another is to determine if two explanatory variables have an impact on a response variable, in other words, are the means the same across each level of an explanatory variables as well the interaction of the explanatory variables on the response. It works in a very subtle way, so lets use the mtcars data frame to make sense of this technique. Let’s say we want to know whether the means of miles per gallon are the same across the levels of cylinders (4, 6, 8) as well as the the means of miles per gallon across the transmission types (i.e., manual and automatic).
Example 1: A farmer has three types of fertilizer and four types of corn. She wants to determine whether the three types of fertilizer and four types of corn has the same impact on her crop yield. They are three questions that she could ask:
- Is the population mean of crop yield the same for each fertilizer?
- Is the population mean of crop yield the same for each type of corn?
- Is there an interaction effect on crop yield between fertilizer and corn type?
Example 2: Does the type of drink (red bull, coffee, orange juice or water) or type of food (donuts or eggs) before a 10K have an impact on finishing time? Again, there are now three questions that can be asked:
- Determine whether the population mean of finishing time of the 10K the same for these four drinks.
- Determine whether the population mean of finishing time of the 10K the same for the two types of food.
- Determine whether there is an interaction effect between food and drink types on the 10K finishing time.
‘Commit Here: state what you just did for your message’
What do you notice here with these two examples?
- There are 3 variables
- One variable is quantitative and the other two are categorical or categorical binary
- Example 1: Corn type (Categorical), Fertilizer type (Categorical) & Crop Yield (Quantitative)
- Example 2: Food type (Categorical Binary) Type of Drink (Categorical) & Finishing Time (Quantitative)
Question 1: Create an example when it would be appropriate to implement Two-Way ANOVA. State the variables, their types (i.e., categorical “binary” or quantitative), and which are the explanatory variables and response variable.
‘Commit Here: state what you just did for your message’
Hypothesis Testing
The null hypothesis for Two-Way ANOVA is that the population means are equal across both explanatory variables. For example 1,
- the null hypothesis would be that the population means of crop yields are the same for each type of fertilizer
- the null hypothesis would be that the population means of crop yields are the same for each type of corn
- the null hypothesis for the interaction effect (both corn and fertilizer types) would be that there is not an interaction effect
In example 2,
- the null hypothesis would be that the population means of finishing time are the across drink type
- the null hypothesis would be that the population means of finishing time are the across food type.
- the null hypothesis for the interaction effect (both food and drink types) would be that there is not an interaction effect
On the other hand, the alternative hypothesis for One-Way ANOVA is the complement of the null hypothesis which is that at least one of the population means is different from the others. In example 1,
- at least one of the fertilizer types population mean of crop yield is different from the other fertilizers
- at least one of the corn types population mean of crop yield is different from the other corns
- there is an interaction effect on crop yield by corn and fertilizer
Or in example 2,
- at least one of the type of drinks population mean of finishing time is different from the others drink types
- at least one of the type of foods population mean of finishing time is different from the others food types
- there is an interaction effect on finishing time by food and drink types
Question 2: State the null the alternative hypotheses for the example that you came up with for your example in question 1.
‘Commit Here: state what you just did for your message’
The general idea is to acquire a sample from the population and use the evidence from the sample to either reject the claim (the null hypothesis) or not reject the claim (the null hypothesis).
Important Caveat: The data that we will investigate does not naturally follow the general premise of statistical theory (we are not taking a random sample), but we will still use the data as material to learn about Two-Way ANOVA even though the population does not exist.
‘Commit Here: state what you just did for your message’
2. The data
Use your data in your R markdown file. Use should not mention mtcars but refer to your data set. Email me if you have any questions.
Nick:
You will use Lg (League) and year to explain the variability in FIPS.
‘Commit Here: state what you just did for your message’
Sid:
You should create a new variable named binary_mp where there are two levels:
- less than 20 named ‘few_mp’
- greater than or equal to 20 named ’large_mp’
You will use binary_mp and position to explain the variability in points scored.
‘Commit Here: state what you just did for your message’
Question 3: State the null the alternative hypotheses based on these variables for your data set.
‘Commit Here: state what you just did for your message’ We will look at how transmission and number of cylinders have an impact on miles per gallon. I make the following adjustments so that we we can analyze the data more efficiently.
mod_mtcars = mtcars %>%
  mutate(cyl = as.factor(cyl),
         am = case_when(
           am == 1 ~ 'manual',
           am == 0 ~ 'automatic'))
The null hypothesis for Two-Way ANOVA in terms of the variables of interest within the mtcars data frame are:
- the null hypothesis would be that the population means of miles per gallon are the same for all three cylinders types
- the null hypothesis would be that the population means of miles per gallon are the same for both manual and automatic cars
- the null hypothesis for the interaction effect (both transmission and cylinder types) would be that there is not an interaction effect on miles per gallon
Where as the alternative hypotheses would be the following:
- at least one of the type of cylinders population mean of miles per gallon is different from the others cylinders types
- at least one of the type of transmission population mean of miles per gallon is different from the others transmission types
- there is an interaction effect on miles per gallon by transmission and cylinder types
3. Visualization
You will need to install and run the following package ‘ggpubr’ to run a Two-Way ANOVA visualizations of the data. ‘Commit Here: state what you just did for your message’
ggboxplot(mod_mtcars, x = "cyl", y = "mpg", color = "am",
          palette = c("#00AFBB", "#E7B800")) +
  labs(x = 'Cylinder', y = 'Miles Per Gallon', title = 'Box Plot for One-Way ANOVA with means') +
  theme(plot.title = element_text(hjust = 0.5, face = 'bold', size = 15))
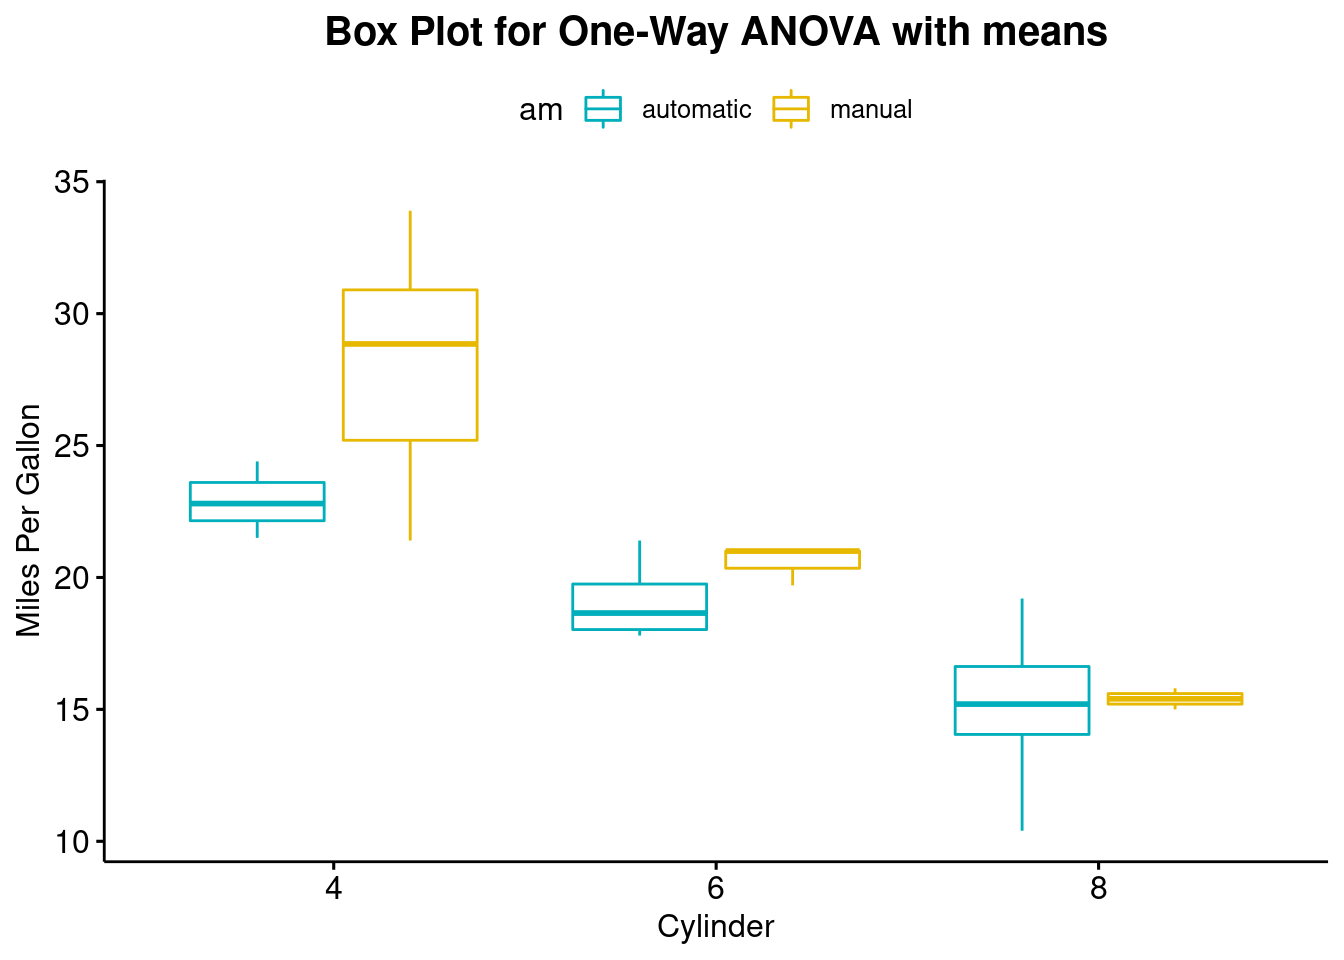 #### Interpretation
-Within each type of cylinder the transmission type always has a higher median of miles per gallon except for when the number of cylinders is 8. It is about the same
- The amount variability of miles per gallon decreases as the number of cylinders increase for manual cars
- But the variability increases as the number of cylinders increase for automatic cars
‘Commit Here: state what you just did for your message’
ggline(mod_mtcars, x = "cyl", y = "mpg", color = "am",
       add = c("mean_se", "dotplot"),
       palette = c("#00AFBB", "#E7B800"))
## Bin width defaults to 1/30 of the range of the data. Pick better value with `binwidth`.
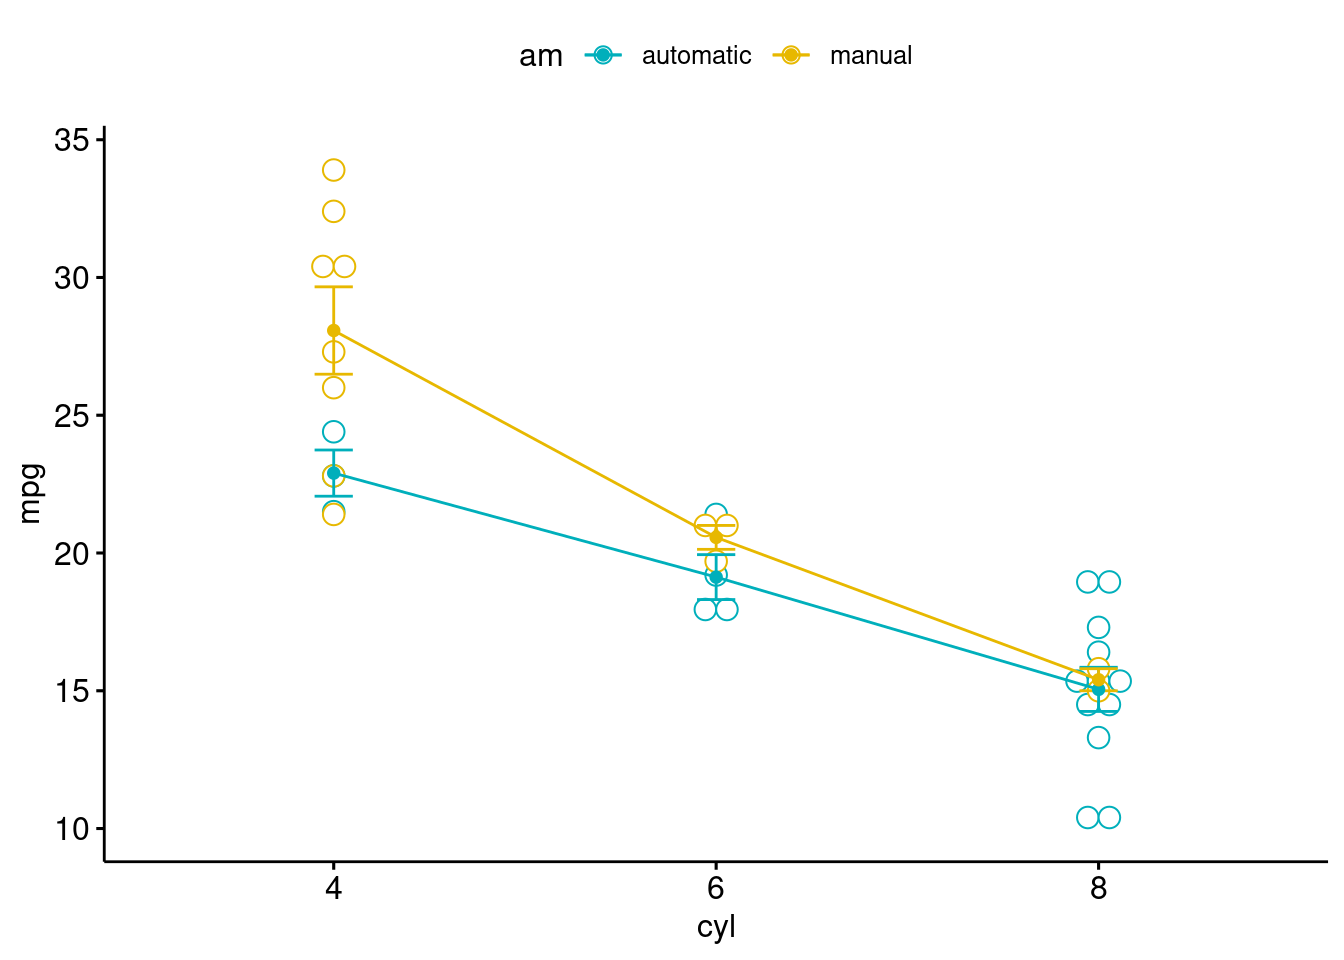
Interpretation
- a clear difference can be seen between means of mpg when the number of is cylinders 4
- the difference decreases as the number of cylinders increase
‘Commit Here: state what you just did for your message’
Next Post …
- Summarization of data